01
Sales steering and tracking
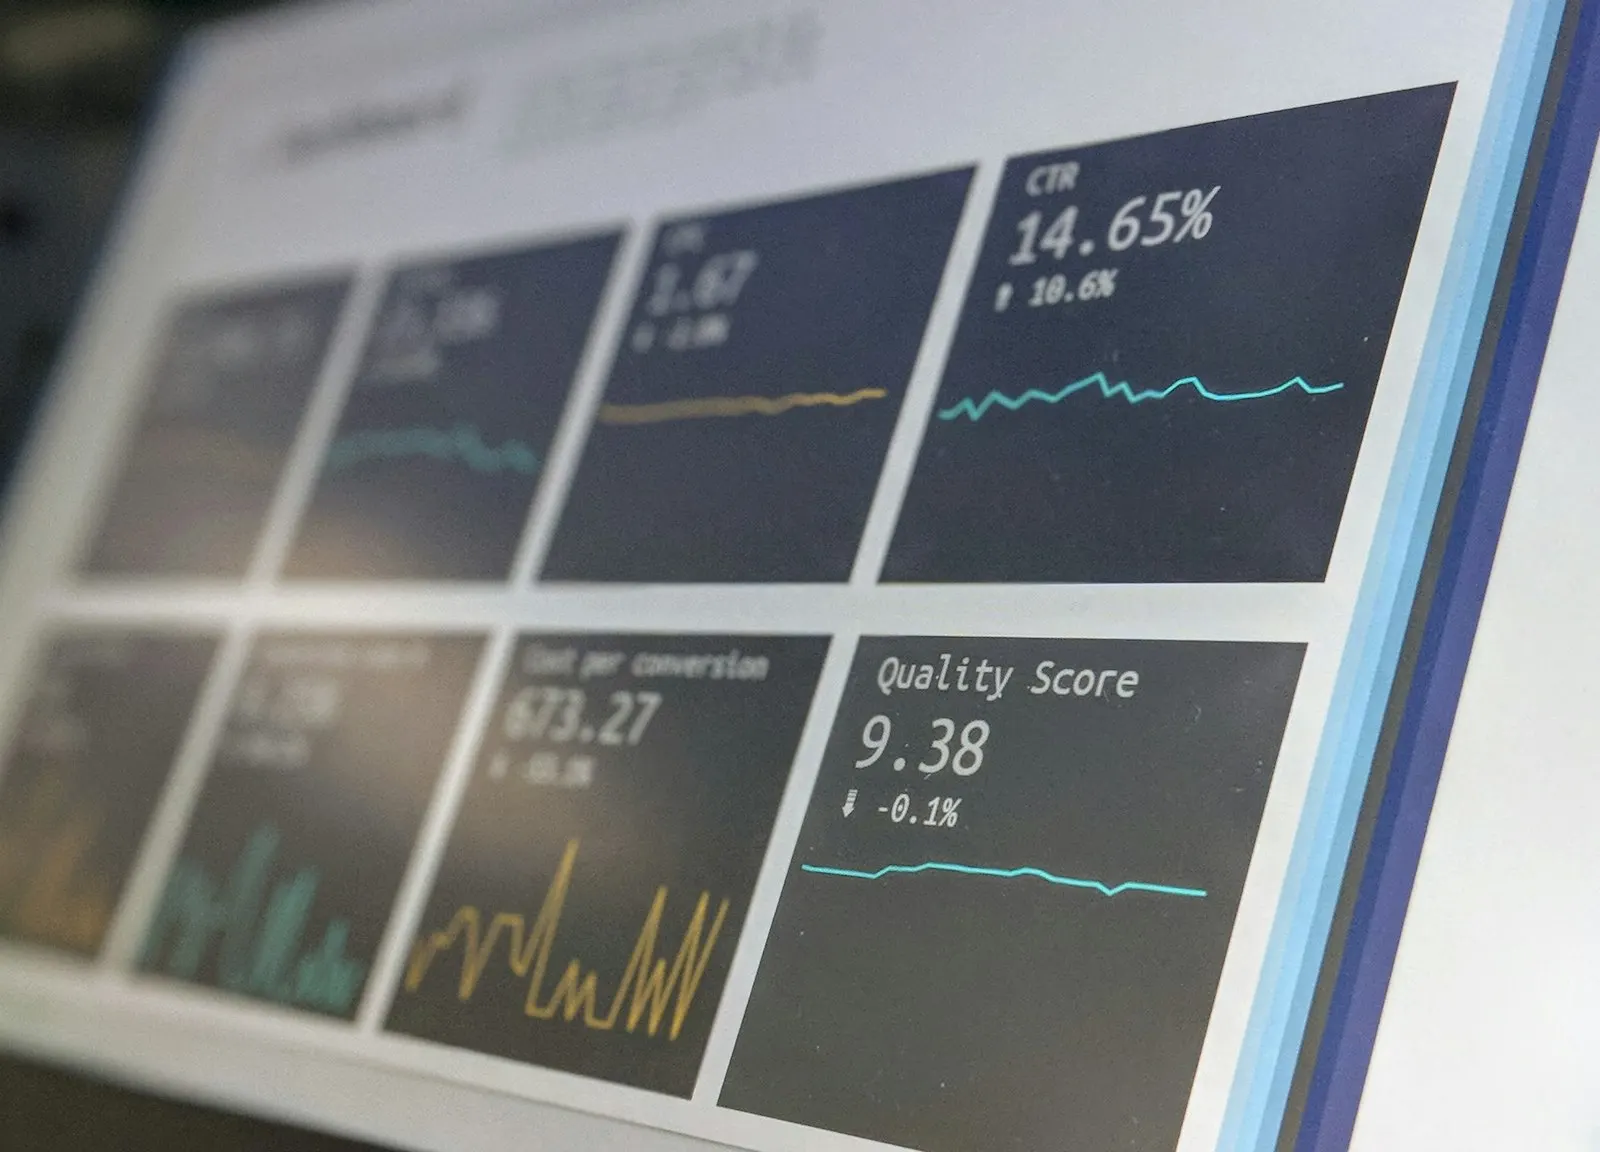
Track your sales performance in real time, by team or region.
- Targets vs actuals
- Per-rep view
- Automatic forecasts
 FronxSolutions
 Expertise
BI · Data · Visualization
Approach
Audit → Design → Prod
Deployment
3–8 weeks
Languages
FR · EN · NL
We build dashboards that track your key metrics in real time so you can make better decisions.
100%
Centralized data
Temps réel
Updates
24/7
Available
100%
Custom-built

Your data deserves better than a spreadsheet
Turn raw data into actionable dashboards, continuously connected to your sources.

Features
Every dashboard connects live to your sources — no stale data, no manual entry.
Drag the globe to explore. Click a glowing node to read its description.
Use cases
Track your sales performance in real time, by team or region.

Centralize your company’s HR and operational metrics.

Monitor your systems’ health and get alerted before failures happen.

Generate clear, professional reports for your strategic meetings.
Our process
Benefits
Connected to your existing tools.
KPIs defined from day one.
Validation in 2–3 weeks.
EU hosting, encrypted APIs.
Integrations
Compatible with your databases, data warehouses and existing tools.
Technologies
CRM, ERP, SQL databases, Google Sheets, APIs — we connect your existing tools.
Yes, as needed: scheduled or near real-time refresh.
3 to 5 weeks for a connected, functional dashboard, depending on source complexity.
Your team, via a simple interface — we train you on how to use it.
From €3,000 for a dashboard connected to one source, custom quote beyond that.

Fronx Chat
Online · AI assistant
Hi 👋 I’m the FronxSolutions assistant. Ask me anything or tell me about your project — I’ll reply right away.